rfalconcam - Imprints

Imprints

The Journal of Rfalconcam

Quest Visiting Family at End of November?

December 1st, 2009

Quest Map End of November 2009
Click the map for a larger view

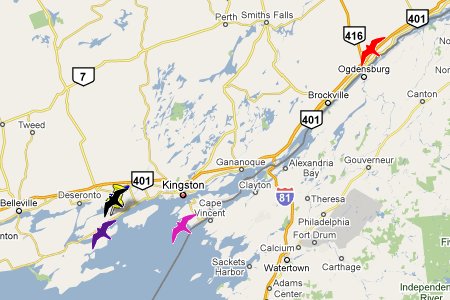
Just when we think Quest may have settled into a pattern she throws yet another specto subitus moment at us. With few exceptions, she’s been sticking close to the Lennox power station, no doubt content to feast on the plentiful prey in the surrounding wetland and on the Lake Ontario shore. But on the final day of November, she decided to wing her way up the St. Lawrence Seaway to the town of Ogdensburg, NY. You may recall that back in April we learned that Sabrina, from Mariah and Kaver’s 2006 brood, had taken residence in a nest box on the Ogdensburg-Prescott International Bridge. Two strong signals on the morning of the 30th place Quest within one mile (1.6 km) of the bridge. Could she have been paying a visit to her brother?

Did you catch that? Yep, we said brother. It’s not a typo. Courtesy of June Summers comes word that the folks monitoring the nest box on the Ogdensburg-Prescott International Bridge witnessed mating between our Sabrina and the other resident female, with Sabrina in the male role. June attended a recent state-wide Audubon Society conference where she recieved the news. She also learned that Sabrina/Valiant and his mate produced one eyas this year which unfortunately did not survive. So our supposition that Sabrina is a male has been verified, and it looks like a name change is in order!

Quest Keeps Coasting

November 16th, 2009


View Quest Travels November 2009 in a larger map

Quest remains locked in on the northeast end of Lake Ontario. Her newfound base of operations at the Lennox power station is obvious for its dual smokestacks, but now we hear that there is also a nest box installed at the facility. We have no way of knowing whether she’s using it, but it seems likely that Quest has at least given the box a look. There aren’t any cameras installed, but we’re hopeful someone may soon spot her at the plant.

Another attraction for Quest may be the 120-acre wetland on the plant’s grounds. The Lennox folks received the Wings Over Wetlands award from the Wildlife Habitat Council and Ducks Unlimited, Inc. in 2008. Read more about it in their newsletter. Thanks to Falconcam fan Chrissy for the link!

An active wetland full of migratory birds and waterfowl combined with tall smokestacks overlooking the lake sounds like a nearly perfect habitat for Quest. It’s no wonder she’s decided to stick around!

Not Much Change For Quest

November 9th, 2009

Quest Map Oct 29 - Nov 8

It certainly looks like Quest is settling in near Kingston, Ontario. With the exception of a quick visit to Olcott, New York on the 30th of October, she’s been pretty consistent in her movements north of Lake Ontario. So it seems, for the most part, Quest will be a guest of our friends in Canada for the time being.

Scrape Up Our New 2010 Calendars

November 1st, 2009

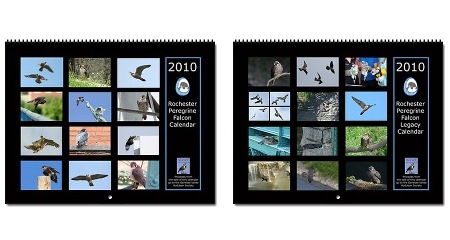
2010 RFC Calendars
This year the Rochester Falconcam is pleased to offer two calendars for 2010, just in time for holiday gift buying! The Peregrine Falcons of Rochester calendar features pictures of falcons new and old that have graced the Rochester skies in the past year. The Rochester Peregrine Falcon Legacy calendar includes Mariah, Kaver and their offspring.

Each month you’ll be greeted with a classic image taken by one of our talented local photographers. That’s 24 pictures in all, each accompanied by an informative caption.

Don’t wait! Click over to The Scrape and order your 2010 calendars today!

Quest Ends October at Lennox Power Station

October 29th, 2009


View Quest Travels October 2009 in a larger map with a legend

Over the past week or so it looks like Quest has found herself a new base of operations at the Lennox power plant. Most of her early morning positions place her near the dual-fuel energy producer. It’s location on the shore of Lake Ontario and its pair of tall smokestacks make it an ideal place from which to perch and hunt.

Quest Still Sticking to Northeast Lake Ontario Shore

October 23rd, 2009


View Quest Travels October 2009 in a larger map

The last several days’ locations have Quest moving to the east, away from Port Hope and Wesleyville. In fact, with the exception of one trip west to Nanticoke Ontario on the 15th all of her movements have been eastward.

Her current location is the northern shore of Lake Ontario near Amherst Island. Position data for the past two days places her at the Lennox power station, which has a pair of tall smokestacks; perfect Peregrine perches (thanks to viewer Chrissy for the station ID)! There’s no telling whether she’ll stay here for the winter. Last year at this time she was ensconsed on Cape Cod. Time will tell if she decides to migrate or stick close to the lake.

Mariah & Kaver Legacy Holiday Cards

October 20th, 2009

Xmas Contact Sheet Image_sm
With Fall in full swing the holiday season will be upon us in no time. The Falconcam’s merchandising moguls are hard at work creating new items to adorn your homes or to give as gifts to family and friends.

First up is a collection of limited-edition holiday cards. Get into the holiday spirit with these quality 4×6 inch prints set in heavy card stock. Your order includes all ten cards and envelopes to make sending your holiday wishes easy! Plus, all the proceeds will help support the Rochester Falconcam operations.

Just download and print the convenient ORDER FORM to get your Mariah & Kaver Legacy Holiday Cards while supplies last. And look for more 2009 holiday and gift items coming soon from all of us at the Rochester Falconcam!

Quest Explores Ontario’s Coast

October 14th, 2009


View Quest Travels October 2009 in a larger map

If Quest were driving a car it seems she’d be wearing out the pavement on Highway 401. After spending a few days in the Kingston area she’s back at Port Hope. With colder weather coming in already, we can only wonder what plans she may be hatching for her winter lodgings. Thankfully we’re back online with her transmitter so we’ll be able to watch the details unfold and bring them to you!

We’re going to try something new for our weekly Quest updates. Instead of building separate maps of her movements every few days, we’ll plot her positions for the entire month on a single map. We’ll use the same colored icons that we use on the Where Has Quest Been rolling map to show her most recent locations, and indicate older ones with gray icons. We think that a monthly map provides a more “strategic” view of her wanderings. Comments are welcome!

Quest in September, and Demystifying Satellite Data

October 9th, 2009


View Quest Travels September 2009 in a larger map

In a break from our regular weekly plots, we’ve mapped her entire month to give you a fuller view of how she spent the last few weeks. The big news for Quest in September was, well, not very big at all. She spent nearly all her time in and around Port Hope and Wesleyville. The exception was that on four occasions she ventured west in the vicinity of Clarington. But the great majority of her locations placed her at Port Hope in the wedge of neighborhood streets between Walton Street and Mill Street North/Ontario Street. In fact, she showed up there so often that it would be surprising if she wasn’t spotted by at least one resident (though we haven’t heard of any sightings).

Now that we’re up to date on Quest’s September travels and her data feeds are flowing again, we thought you might benefit from learning a little more about the satellite data we recieve and how it’s interpreted. Basically, we receive an email every evening. It’s sent by the satellite tracking agency at Midnight, Greenwich Mean Time (also known as GMT, or Zulu time, for those in the know). The Eastern Time zone is 5 hours behind GMT, but because we’re currently experiencing Daylight Saving Time, the differential is 4 hours. Thus, we get the emails around 8PM local time here in Rochester.

Each email contains the most recent set of data sent from the transmitter. ARGOS has a constellation of satellites in low-earth polar orbit. That means that the orbit of each satellite takes it over both the north and south poles. The transmitter is set to send a signal each hour, but depending on time of day, weather conditions and the relative positions of the orbiting satellites we may recieve more or fewer transmissions on any given date. Sometimes we get as many as one transmission every hour. Sometimes we get only one or two (or even none) for an entire day. So when we plot Quest’s position we look for the best of the day’s signals.

How do we choose the best? Well, it’s a bit of an art, but for the most part it follows some pretty consistent rules. To see how it works it might be helpful to look at some of the actual tracking data we receive. Here’s a typical example:

59783 Date : 25.08.09 08:11:44 LC : 3 IQ : 66
Lat1 : 43.953N Lon1 : 78.295W Lat2 : 47.255N Lon2 : 95.459W
Nb mes : 005 Nb mes>-120dB : 000 Best level : -131 dB
Pass duration : 362s NOPC : 3
Calcul freq : 401 672154.4 Hz Altitude : 61 m
164 112 02 01

It looks complicated, but it’s not that bad. Let’s break down the data. The transmission begins with the 5-digit number that identifies Quest’s PTT (Platform Transmitter Terminal), followed by the date and time of the transmission. The date format is european, with two digits each for day, month and year separated by periods. So our example above is for the 25th of August, 2009. The time is in 24-hour notation with two digits each for hours, minutes and seconds (8:11 and 44 seconds in our example). The time shown is in GMT, so subtract 5 hours to get Eastern Standard time (subtract 4 for Eastern Daylight Time).

Following the date and time are two more items, the LC (Location Class) and the IQ (Quality Indicator) numbers. The LC and IQ values tell us about the accuracy of the signal. Location Class numbers indicate the accuracy of the transmitted latitude and longitude coordinates. An LC of 3 is the best, indicating that the coordinates are accurate to within 150 meters of the stated position. LC 2 signals are accurate to between 150 and 350 meters, and LC 1 signals are accurate in a radius of 350 to 1000 meters from the stated position. LC values of 0, A, B, or Z also exist, but their accuracy is negligible because the satellites didn’t receive enough signals from the transmitter to generate accurate coordinates.

The IQ value looks like a two-digit number but it’s actually 2 single-digit values, XY. These are fairly technical indicators, but suffice it to say that X can be any digit from 1 to 6, and Y can vary from 1 to 8. Higher numbers are better for both of these values, so the best IQ is 68, but 67, 66, 58 and 57 are also good.

The second line contains the actual coordinates, expressed in standard latitude and longitude notation. We use only the Lat1 and Lon1 values to pinpoint Quest’s location. The Lat2 and Lon2 coordinates are only used for error checking; they don’t correspond to the transmitter’s actual location. To plot the location in Google maps, we just plug in the Lat 1 and Lon1 values.

The next three lines contain diagnostic information that’s used to verify the accuracy of the signal, including the duration of the transmission, received frequency and number of signals received during the satellite pass (more signals means better accuracy, with 4 or more providing the best accuracy). The last line has values for up to four sensors on the PTT. Quest’s transmitter has 2 sensors, so only the first two positions are used. Values for each sensor vary from 0 to 256 (8-bit numbers). Sensor 1 records the internal temperature of the transmitter. It tells us something about the ambient weather conditions. We use a formula to translate the value transmitted by the sensor into an actual reading between 0° and 58° Centigrade. Sensor 2 indicates the voltage in the transmitter’s battery, with the 8-bit number corresponding to a voltage range between 3.2 and 4.2 volts. Sensor data are not sent with every transmission.

Now that you know what the data means, you’re probably wondering how we put it all together. First we look for transmissions with high LC and IQ values. Next we check to see if any of these good quality signals has a temperature reading. Finally, we look for signals at various times of the day (morning, afternoon, evening, night) on different days. We know that time of day has an effect on Quest’s likely behavior, so we try to get a mix of times so that we can see her positions when she’s at rest, during typical hunting times, and so on.

So there you have it, a crash course in satellite telemetry interpretation. Finding a signal that meets all these requirements means that sometimes we trade off one item against another. For instance, we may choose a signal with LC2 over an LC3 signal if the IQ is better, or if the LC2 signal has a temperature reading. If we have a few good signals in the day, we’ll try to choose one that’s at a different time from the day before, and so on. Sometimes our only choice is a relatively poor LC1 transmission. Sometimes we don’t get any good signals for a given day. But overall, plotting positions day by day, we’re able to build up a pretty decent picture of what Quest is doing and where she’s been.
‘Quest’s Week’ Updated, More to Follow

October 8th, 2009


View Quest’s Week in a larger map

We’ve updated the Quest’s Week map with her movements for the past week. As you can see, she only recently left the Port Hope area. It looks like she’s bouncing back and forth over the border near the east end of Lake Ontario, perhaps waiting for favorable weather before making a more decisive move.

We haven’t had a chance to comb through the older data yet but we’ll work on getting more maps published in the coming days!


Sponsored By

Times Square
powered by Shakymon